Welcome to Megan Mai - Data Analytics Portfolio Page
Hi, it’s Megan, a Data Analyst from Dublin from Generation Ireland/ UK with strong knowledge domain of Marketing and Business
Here is a place to show my projects using Python, SQL and Power BI
Please contact me via my email and linkedin
Python and SQL - Data Analytics and Visualizations
SQL, Python (pandas, matplotlib, plotly, json)
Using SQL for data manipulation and Python (pandas, matplotlib, plotly, geojson) for Data visualization
This project contains 2 parts:
- Transform the data in SQL Serer (SSMS)
- Process and Visualize Data in Python
This project is working the AdventureWorks Database from Microsoft.
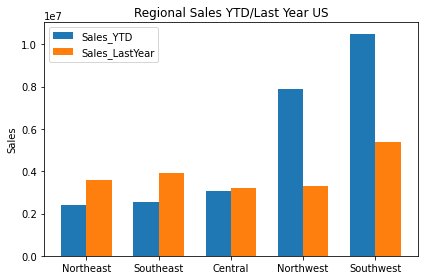
Double Bar Chart (MatPlotLib) showing the differences between regions
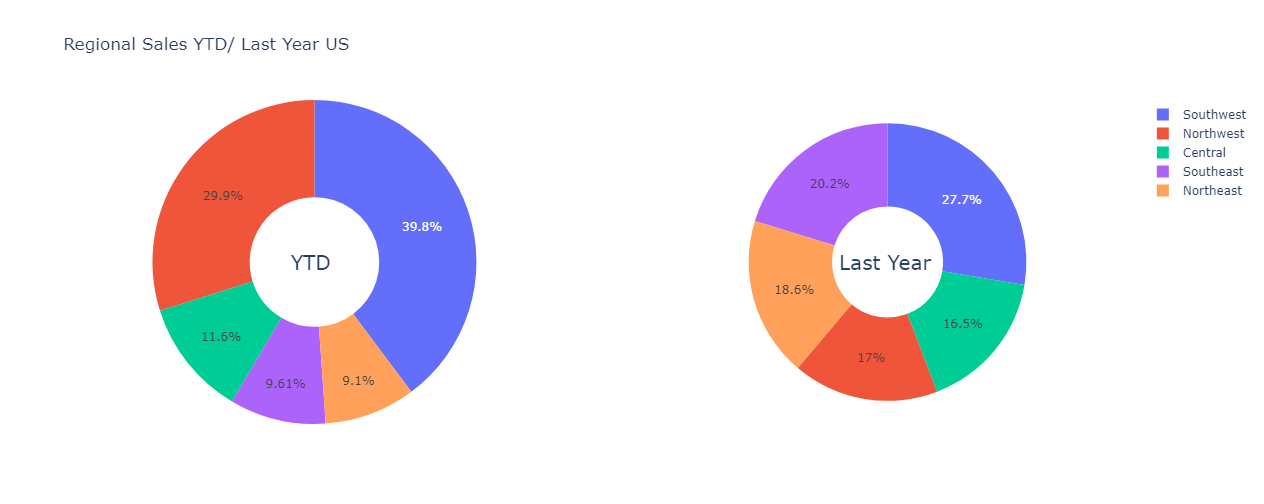
Double Donut Chart (Plotly) showing the differences of sales volumes and percentage between years
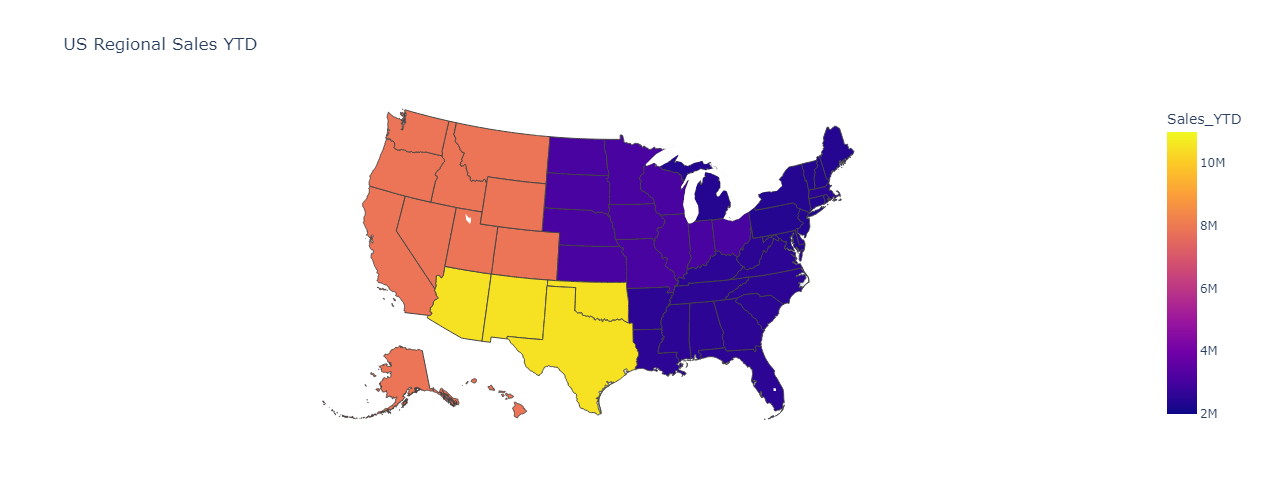
Map Chart (Plotly/ Json) showing the differences of sales volumes within the region geographically
Python and Power BI/ DAX - Olist-E-commerce-Bussiness-Intelligence
Python, DAX, Power BI
Using SQL, Python and Power BI to analyze and visualize e-commerce data from Olist - the leading Brazilian e-commerce platform There are two main parts:
- Seller Intelligence
- Product Atrribute
- Sales Performance Analysis
- Logistic Performance Analysis
- Customer insights
- Sentimental Analysis
This project is based on the dataset provided by Olist
Here is the completed dashboard
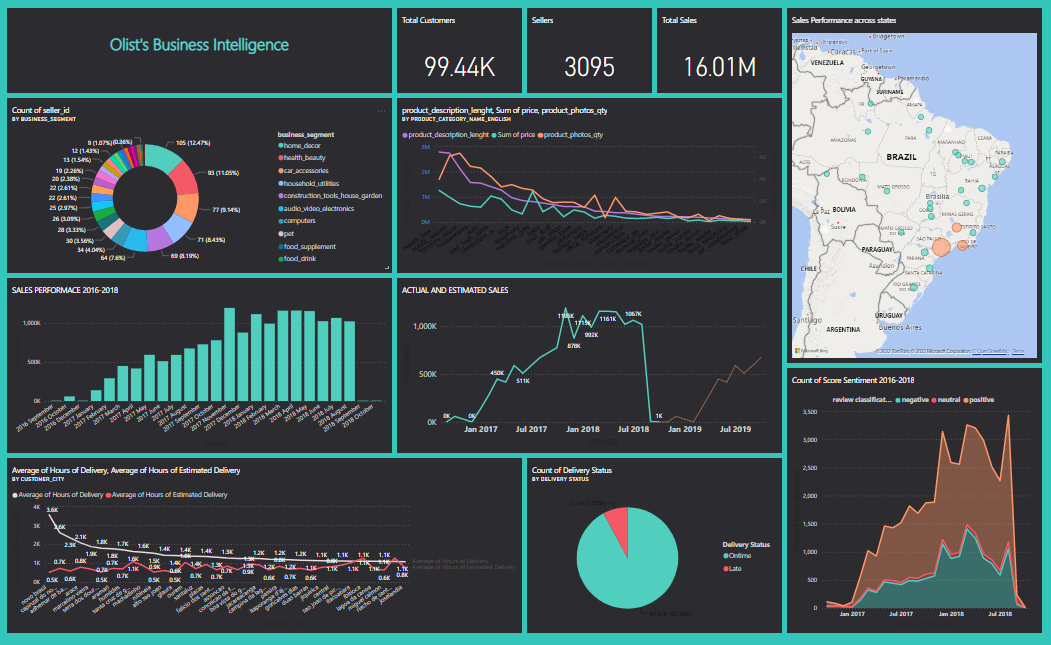
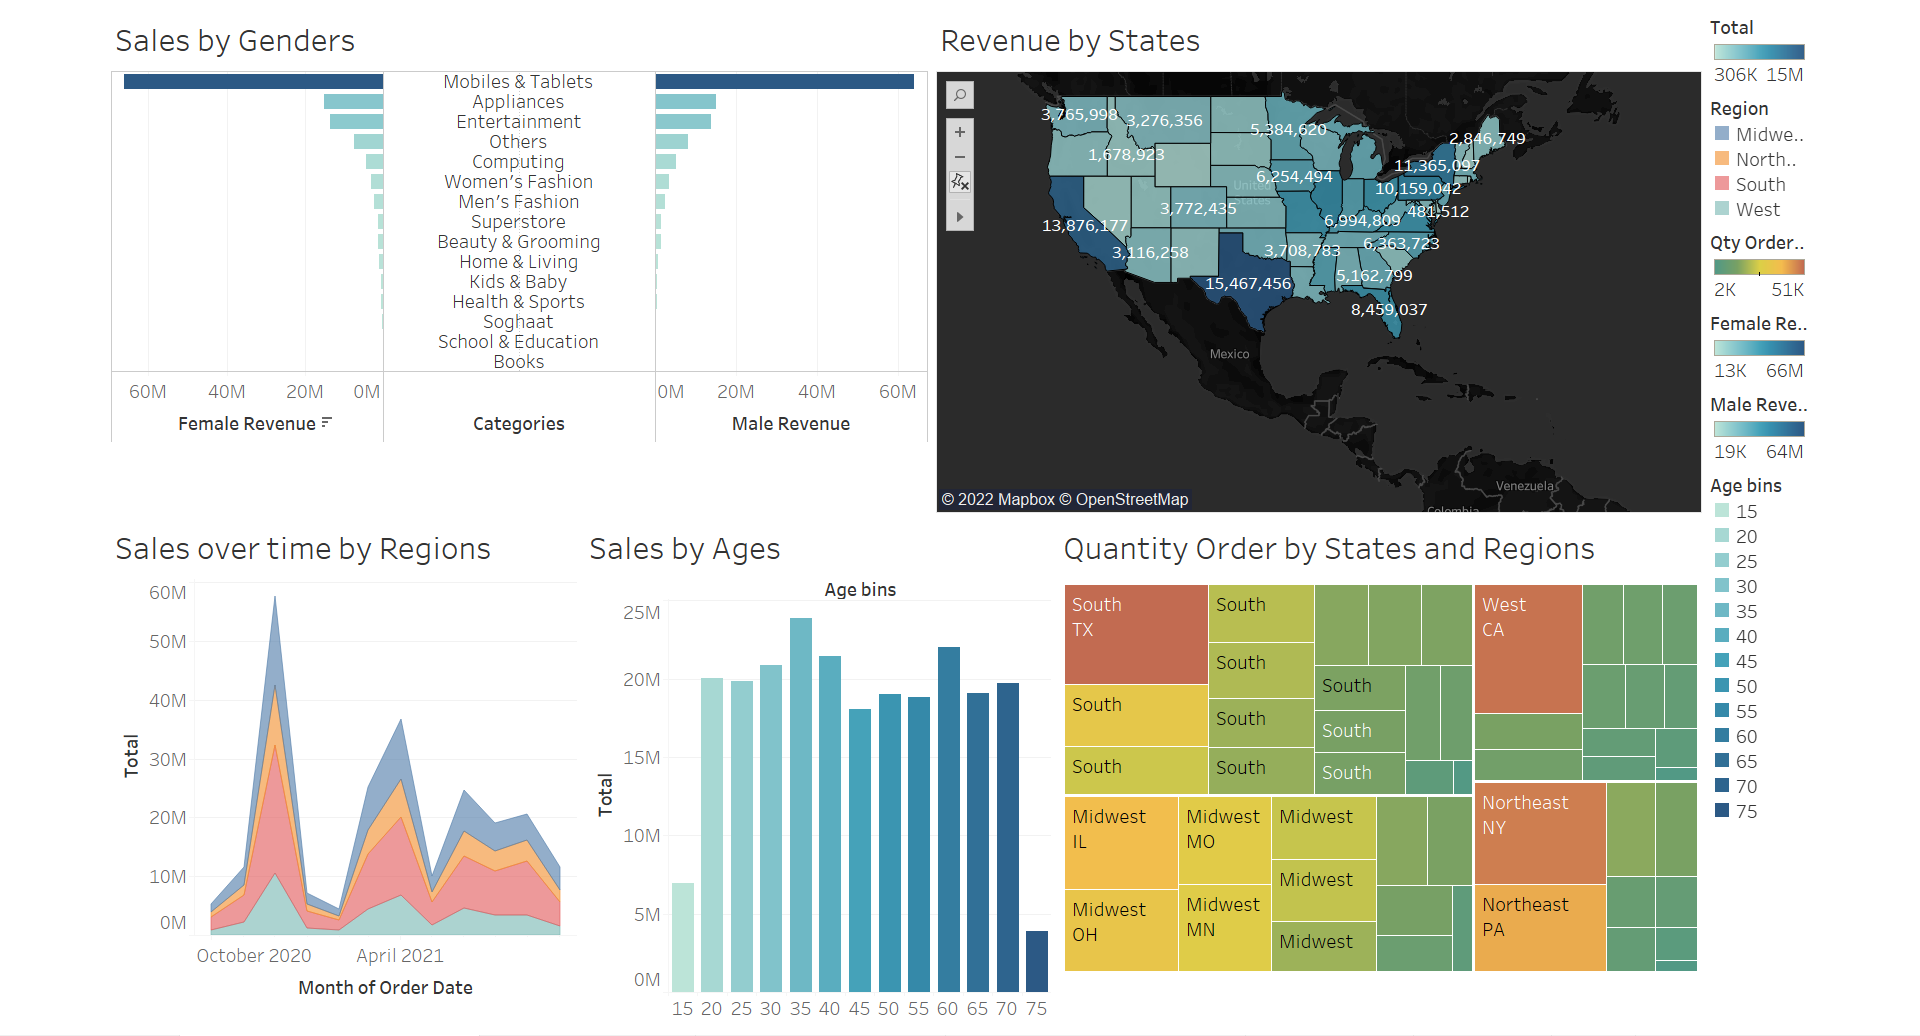
Tableau - Sales Analytics
Tableau
Using Tableau build a Sales Analytics/ Business Intelligence Dashboard.
- Revenue by Regions and States
- Revenue by Genders and Ages
- Sales performance over time